
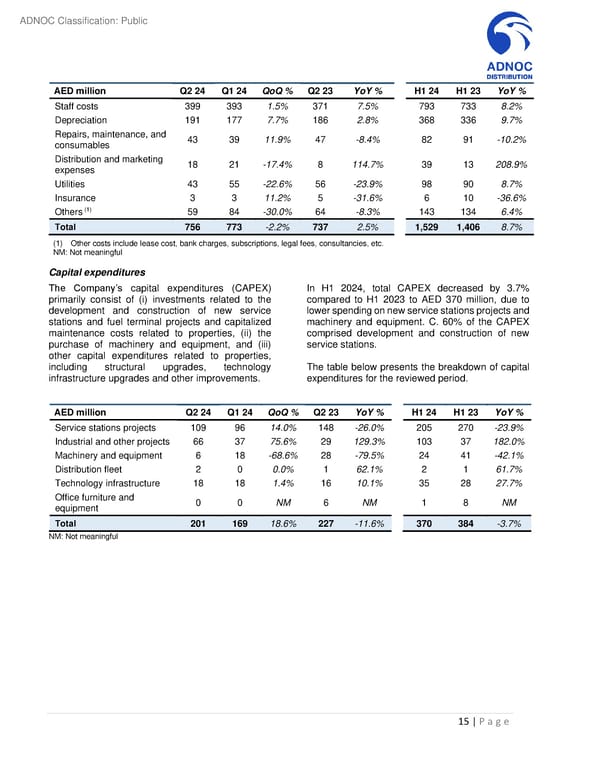
ADNOC Classification: Public AED million Q2 24 Q1 24 QoQ % Q2 23 YoY % H1 24 H1 23 YoY % Staff costs 399 393 1.5% 371 7.5% 793 733 8.2% Depreciation 191 177 7.7% 186 2.8% 368 336 9.7% Repairs, maintenance, and 43 39 11.9% 47 -8.4% 82 91 -10.2% consumables Distribution and marketing 18 21 -17.4% 8 114.7% 39 13 208.9% expenses Utilities 43 55 -22.6% 56 -23.9% 98 90 8.7% Insurance 3 3 11.2% 5 -31.6% 6 10 -36.6% Others (1) 59 84 -30.0% 64 -8.3% 143 134 6.4% Total 756 773 -2.2% 737 2.5% 1,529 1,406 8.7% (1) Other costs include lease cost, bank charges, subscriptions, legal fees, consultancies, etc. NM: Not meaningful Capital expenditures The Company’s capital expenditures (CAPEX) In H1 2024, total CAPEX decreased by 3.7% primarily consist of (i) investments related to the compared to H1 2023 to AED 370 million, due to development and construction of new service lower spending on new service stations projects and stations and fuel terminal projects and capitalized machinery and equipment. C. 60% of the CAPEX maintenance costs related to properties, (ii) the comprised development and construction of new purchase of machinery and equipment, and (iii) service stations. other capital expenditures related to properties, including structural upgrades, technology The table below presents the breakdown of capital infrastructure upgrades and other improvements. expenditures for the reviewed period. AED million Q2 24 Q1 24 QoQ % Q2 23 YoY % H1 24 H1 23 YoY % Service stations projects 109 96 14.0% 148 -26.0% 205 270 -23.9% Industrial and other projects 66 37 75.6% 29 129.3% 103 37 182.0% Machinery and equipment 6 18 -68.6% 28 -79.5% 24 41 -42.1% Distribution fleet 2 0 0.0% 1 62.1% 2 1 61.7% Technology infrastructure 18 18 1.4% 16 10.1% 35 28 27.7% Office furniture and 0 0 NM 6 NM 1 8 NM equipment Total 201 169 18.6% 227 -11.6% 370 384 -3.7% NM: Not meaningful 15 | P a g e
 Second Quarter and First Half 2024 Results Page 14 Page 16