
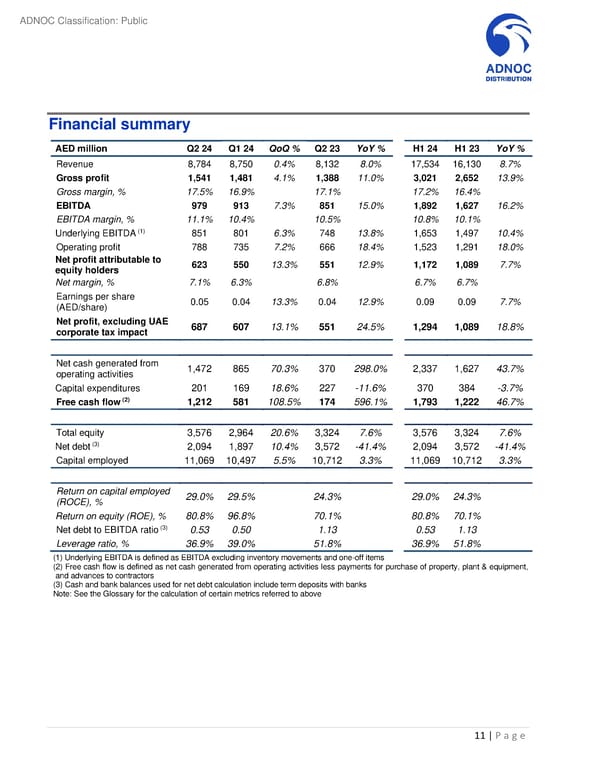
ADNOC Classification: Public Financial summary AED million Q2 24 Q1 24 QoQ % Q2 23 YoY % H1 24 H1 23 YoY % Revenue 8,784 8,750 0.4% 8,132 8.0% 17,534 16,130 8.7% Gross profit 1,541 1,481 4.1% 1,388 11.0% 3,021 2,652 13.9% Gross margin, % 17.5% 16.9% 17.1% 17.2% 16.4% EBITDA 979 913 7.3% 851 15.0% 1,892 1,627 16.2% EBITDA margin, % 11.1% 10.4% 10.5% 10.8% 10.1% (1) Underlying EBITDA 851 801 6.3% 748 13.8% 1,653 1,497 10.4% Operating profit 788 735 7.2% 666 18.4% 1,523 1,291 18.0% Net profit attributable to 623 550 13.3% 551 12.9% 1,172 1,089 7.7% equity holders Net margin, % 7.1% 6.3% 6.8% 6.7% 6.7% Earnings per share 0.05 0.04 13.3% 0.04 12.9% 0.09 0.09 7.7% (AED/share) Net profit, excluding UAE 687 607 13.1% 551 24.5% 1,294 1,089 18.8% corporate tax impact Net cash generated from 1,472 865 70.3% 370 298.0% 2,337 1,627 43.7% operating activities Capital expenditures 201 169 18.6% 227 -11.6% 370 384 -3.7% Free cash flow (2) 1,212 581 108.5% 174 596.1% 1,793 1,222 46.7% Total equity 3,576 2,964 20.6% 3,324 7.6% 3,576 3,324 7.6% (3) Net debt 2,094 1,897 10.4% 3,572 -41.4% 2,094 3,572 -41.4% Capital employed 11,069 10,497 5.5% 10,712 3.3% 11,069 10,712 3.3% Return on capital employed 29.0% 29.5% 24.3% 29.0% 24.3% (ROCE), % Return on equity (ROE), % 80.8% 96.8% 70.1% 80.8% 70.1% (3) Net debt to EBITDA ratio 0.53 0.50 1.13 0.53 1.13 Leverage ratio, % 36.9% 39.0% 51.8% 36.9% 51.8% (1) Underlying EBITDA is defined as EBITDA excluding inventory movements and one-off items (2) Free cash flow is defined as net cash generated from operating activities less payments for purchase of property, plant & equipment, and advances to contractors (3) Cash and bank balances used for net debt calculation include term deposits with banks Note: See the Glossary for the calculation of certain metrics referred to above 11 | P a g e
 Second Quarter and First Half 2024 Results Page 10 Page 12