
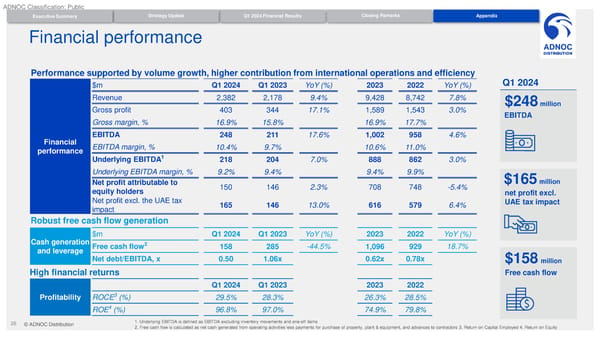
ADNOC Classification: Public Strategy Update Q1 2024 Financial Results Closing Remarks Appendix Executive Summary Q1 2024 Financial Results Financial performance Performance supported by volume growth, higher contribution from international operations and efficiency $m Q1 2024 Q1 2023 YoY (%) 2023 2022 YoY (%) Q1 2024 Revenue 2,382 2,178 9.4% 9,428 8,742 7.8% $248 million Gross profit 403 344 17.1% 1,589 1,543 3.0% EBITDA Gross margin, % 16.9% 15.8% 16.9% 17.7% Financial EBITDA 248 211 17.6% 1,002 958 4.6% performance EBITDA margin, % 10.4% 9.7% 10.6% 11.0% 1 Underlying EBITDA 218 204 7.0% 888 862 3.0% Underlying EBITDA margin, % 9.2% 9.4% 9.4% 9.9% $165 million Net profit attributable to 150 146 2.3% 708 748 -5.4% equity holders net profit excl. Net profit excl. the UAE tax 165 146 13.0% 616 579 6.4% UAE tax impact impact Robust free cash flow generation $m Q1 2024 Q1 2023 YoY (%) 2023 2022 YoY (%) Cash generation Free cash flow2 158 285 -44.5% 1,096 929 18.7% and leverage Net debt/EBITDA, x 0.50 1.06x 0.62x 0.78x $158 million High financial returns Free cash flow Q1 2024 Q1 2023 2023 2022 3 Profitability ROCE (%) 29.5% 28.3% 26.3% 28.5% 4 ROE (%) 96.8% 97.0% 74.9% 79.8% 26 © ADNOC Distribution 1. Underlying EBITDA is defined as EBITDA excluding inventory movements and one-off items 2. Free cash flow is calculated as net cash generated from operating activities less payments for purchase of property, plant & equipment, and advances to contractors 3. Return on Capital Employed 4. Return on Equity
 Presentation Page 25