
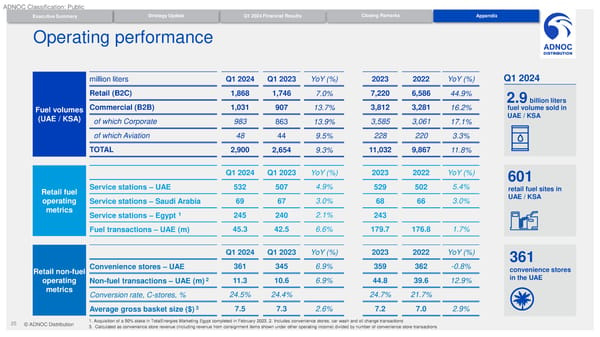
ADNOC Classification: Public Strategy Update Q1 2024 Financial Results Closing Remarks Appendix Executive Summary Q1 2024 Financial Results Operating performance million liters Q1 2024 Q1 2023 YoY (%) 2023 2022 YoY (%) Q1 2024 Retail (B2C) 1,868 1,746 7.0% 7,220 6,586 44.9% 2.9 billion liters Fuel volumes Commercial (B2B) 1,031 907 13.7% 3,812 3,281 16.2% fuel volume sold in (UAE / KSA) of which Corporate 983 863 13.9% 3,585 3,061 17.1% UAE / KSA of which Aviation 48 44 9.5% 228 220 3.3% TOTAL 2,900 2,654 9.3% 11,032 9,867 11.8% Q1 2024 Q1 2023 YoY (%) 2023 2022 YoY (%) 601 Retail fuel Service stations – UAE 532 507 4.9% 529 502 5.4% retail fuel sites in operating Service stations – Saudi Arabia 69 67 3.0% 68 66 3.0% UAE / KSA metrics Service stations – Egypt 1 245 240 2.1% 243 Fuel transactions – UAE (m) 45.3 42.5 6.6% 179.7 176.8 1.7% Q1 2024 Q1 2023 YoY (%) 2023 2022 YoY (%) 361 Retail non-fuel Convenience stores – UAE 361 345 6.9% 359 362 -0.8% convenience stores operating 2 11.3 10.6 6.9% 44.8 39.6 12.9% in the UAE Non-fuel transactions – UAE (m) metrics Conversion rate, C-stores, % 24.5% 24.4% 24.7% 21.7% Average gross basket size ($) 3 7.5 7.3 2.6% 7.2 7.0 2.9% 25 © ADNOC Distribution 1. Acquisition of a 50% stake in TotalEnergies Marketing Egypt completed in February 2023. 2. Includes convenience stores, car wash and oil change transactions 3. Calculated as convenience store revenue (including revenue from consignment items shown under other operating income) divided by number of convenience store transactions
 Presentation Page 24 Page 26