
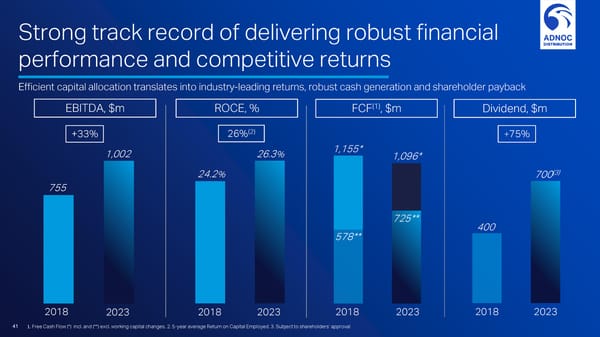
Strong track record of delivering robust financial performance and competitive returns Efficient capital allocation translates into industry-leading returns, robust cash generation and shareholder payback EBITDA, $m ROCE, % (1) FCF , $m Dividend, $m (2) +33% 26% +75% 1,002 26.3% 1,155* 1,096* 24.2% 700(3) 755 725** 400 578** 2018 2023 2018 2023 2018 2023 2018 2023 41 1. Free Cash Flow (*) incl. and (**) excl. working capital changes. 2. 5-year average Return on Capital Employed. 3. Subject to shareholders’ approval
 Investor Day Page 40 Page 42