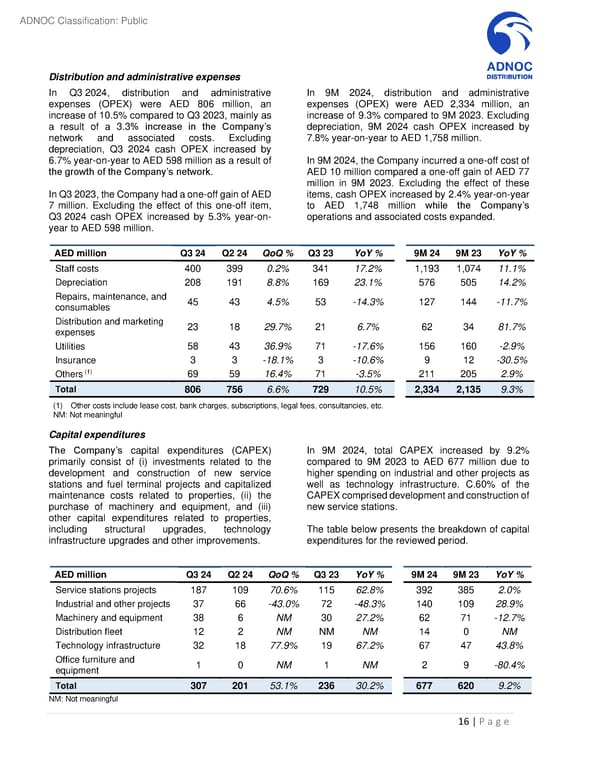
ADNOC Classification: Public Distribution and administrative expenses In Q3 2024, distribution and administrative In 9M 2024, distribution and administrative expenses (OPEX) were AED 806 million, an expenses (OPEX) were AED 2,334 million, an increase of 10.5% compared to Q3 2023, mainly as increase of 9.3% compared to 9M 2023. Excluding a result of a 3.3% increase in the Company’s depreciation, 9M 2024 cash OPEX increased by network and associated costs. Excluding 7.8% year-on-year to AED 1,758 million. depreciation, Q3 2024 cash OPEX increased by 6.7% year-on-year to AED 598 million as a result of In 9M 2024, the Company incurred a one-off cost of the growth of the Company’s network. AED 10 million compared a one-off gain of AED 77 million in 9M 2023. Excluding the effect of these In Q3 2023, the Company had a one-off gain of AED items, cash OPEX increased by 2.4% year-on-year 7 million. Excluding the effect of this one-off item, to AED 1,748 million while the Company’s Q3 2024 cash OPEX increased by 5.3% year-on- operations and associated costs expanded. year to AED 598 million. AED million Q3 24 Q2 24 QoQ % Q3 23 YoY % 9M 24 9M 23 YoY % Staff costs 400 399 0.2% 341 17.2% 1,193 1,074 11.1% Depreciation 208 191 8.8% 169 23.1% 576 505 14.2% Repairs, maintenance, and 45 43 4.5% 53 -14.3% 127 144 -11.7% consumables Distribution and marketing 23 18 29.7% 21 6.7% 62 34 81.7% expenses Utilities 58 43 36.9% 71 -17.6% 156 160 -2.9% Insurance 3 3 -18.1% 3 -10.6% 9 12 -30.5% Others (1) 69 59 16.4% 71 -3.5% 211 205 2.9% Total 806 756 6.6% 729 10.5% 2,334 2,135 9.3% (1) Other costs include lease cost, bank charges, subscriptions, legal fees, consultancies, etc. NM: Not meaningful Capital expenditures The Company’s capital expenditures (CAPEX) In 9M 2024, total CAPEX increased by 9.2% primarily consist of (i) investments related to the compared to 9M 2023 to AED 677 million due to development and construction of new service higher spending on industrial and other projects as stations and fuel terminal projects and capitalized well as technology infrastructure. C.60% of the maintenance costs related to properties, (ii) the CAPEX comprised development and construction of purchase of machinery and equipment, and (iii) new service stations. other capital expenditures related to properties, including structural upgrades, technology The table below presents the breakdown of capital infrastructure upgrades and other improvements. expenditures for the reviewed period. AED million Q3 24 Q2 24 QoQ % Q3 23 YoY % 9M 24 9M 23 YoY % Service stations projects 187 109 70.6% 115 62.8% 392 385 2.0% Industrial and other projects 37 66 -43.0% 72 -48.3% 140 109 28.9% Machinery and equipment 38 6 NM 30 27.2% 62 71 -12.7% Distribution fleet 12 2 NM NM NM 14 0 NM Technology infrastructure 32 18 77.9% 19 67.2% 67 47 43.8% Office furniture and 1 0 NM 1 NM 2 9 -80.4% equipment Total 307 201 53.1% 236 30.2% 677 620 9.2% NM: Not meaningful 16 | P a g e
 Third Quarter and Nine Months 2024 Results Page 15 Page 17