
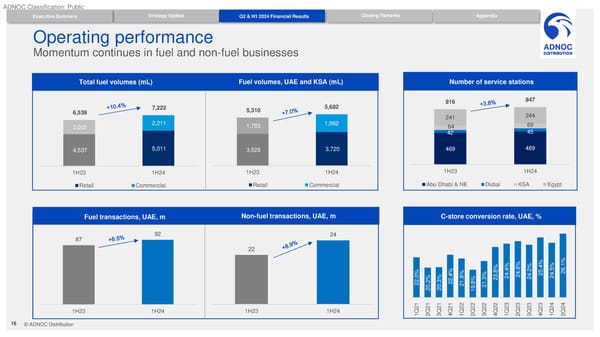
ADNOC Classification: Public Executive Summary Strategy Update Q2 & H1 2024 Financial Results Closing Remarks Appendix Operating performance Momentum continues in fuel and non-fuel businesses Total fuel volumes (mL) Fuel volumes, UAE and KSA (mL) Number of service stations 816 847 6,539 7,222 5,310 5,682 241 244 2,002 2,211 1,783 1,962 64 69 42 45 4,537 5,011 3,528 3,720 469 489 1H23 1H24 1H23 1H24 1H23 1H24 Retail Commercial Retail Commercial Abu Dhabi & NE Dubai KSA Egypt Fuel transactions, UAE, m Non-fuel transactions, UAE, m C-store conversion rate, UAE, % 87 92 24 22 % % % % .1% % % .4 .8 .2% 5.4 .5 6 % .4 % % 3.8 24 24 4 2 24 2 .02 .2% .3% 22 1.8 % 1.3 2 2 2 20 20 2 9.8 2 1 21 21 21 21 22 22 22 22 23 23 23 23 24 24 1H23 1H24 1H23 1H24 1Q 2Q 3Q 4Q 1Q 2Q 3Q 4Q 1Q 2Q 3Q 4Q 1Q 2Q 16 © ADNOC Distribution
 Q2 / H1 2024 Results Page 15 Page 17