
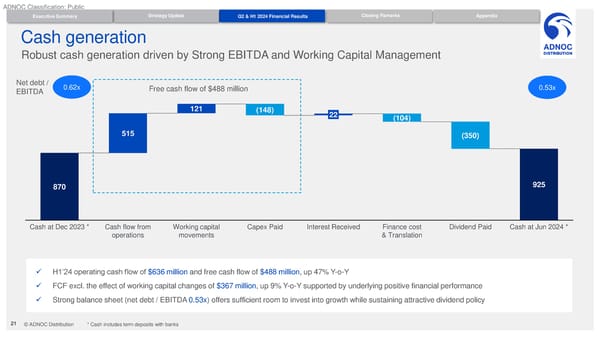
ADNOC Classification: Public Executive Summary Strategy Update Q2 & H1 2024 Financial Results Closing Remarks Appendix Cash generation Robust cash generation driven by Strong EBITDA and Working Capital Management Net debt / 0.62x Free cash flow of $488 million 0.53x EBITDA 121 (148) 22 (104) 515 (350) 870 925 Cash at Dec 2023 * Cash flow from Working capital Capex Paid Interest Received Finance cost Dividend Paid Cash at Jun 2024 * operations movements & Translation ✓ H1’24 operating cash flow of $636 million and free cash flow of $488 million, up 47% Y-o-Y ✓ FCF excl. the effect of working capital changes of $367 million, up 9% Y-o-Y supported by underlying positive financial performance ✓ Strong balance sheet (net debt / EBITDA 0.53x) offers sufficient room to invest into growth while sustaining attractive dividend policy 21 © ADNOC Distribution * Cash includes term deposits with banks
 Q2 / H1 2024 Results Page 20 Page 22