
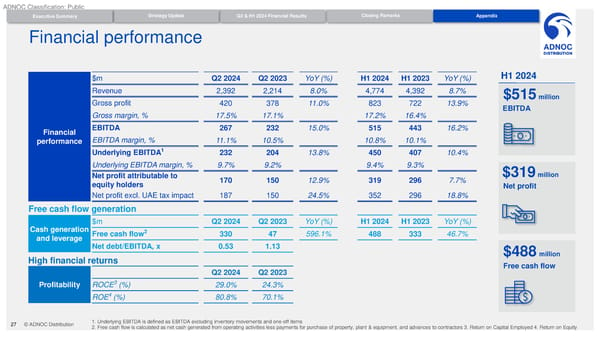
ADNOC Classification: Public Strategy Update Q2 & H1 2024 Financial Results Closing Remarks Appendix Executive Summary Q1 2024 Financial Results Financial performance $m Q2 2024 Q2 2023 YoY (%) H1 2024 H1 2023 YoY (%) H1 2024 Revenue 2,392 2,214 8.0% 4,774 4,392 8.7% $515 million Gross profit 420 378 11.0% 823 722 13.9% EBITDA Gross margin, % 17.5% 17.1% 17.2% 16.4% Financial EBITDA 267 232 15.0% 515 443 16.2% performance EBITDA margin, % 11.1% 10.5% 10.8% 10.1% 1 Underlying EBITDA 232 204 13.8% 450 407 10.4% Underlying EBITDA margin, % 9.7% 9.2% 9.4% 9.3% $319 million Net profit attributable to 170 150 12.9% 319 296 7.7% equity holders Net profit Net profit excl. UAE tax impact 187 150 24.5% 352 296 18.8% Free cash flow generation $m Q2 2024 Q2 2023 YoY (%) H1 2024 H1 2023 YoY (%) Cash generation Free cash flow2 330 47 596.1% 488 333 46.7% and leverage Net debt/EBITDA, x 0.53 1.13 $488 million High financial returns Free cash flow Q2 2024 Q2 2023 3 Profitability ROCE (%) 29.0% 24.3% 4 ROE (%) 80.8% 70.1% 27 © ADNOC Distribution 1. Underlying EBITDA is defined as EBITDA excluding inventory movements and one-off items 2. Free cash flow is calculated as net cash generated from operating activities less payments for purchase of property, plant & equipment, and advances to contractors 3. Return on Capital Employed 4. Return on Equity
 Q2 / H1 2024 Results Page 26 Page 28